


Evaluation of Cytopathic Effects in Uninfected Cell Cultures Under Varying Fetal Bovine Serum and Antibiotic Concentrations.
By Matthew North - 27 January 2025

This study can be downloaded in pdf format by following this link.
Evaluation of Cytopathic Effects in Uninfected Cell Cultures Under Varying Fetal Bovine Serum and Antibiotic Concentrations
Matthew North1
1USA, matthewnorth@finmail.com
Date: 27 January 2025
Keywords: Cytopathic Effects (CPE), Human Embryonic Kidney (HEK293T) cells, Fetal Bovine Serum (FBS), Antibiotic concentrations, Cell culture, Viral isolation protocols, Transmission Electron Microscopy (TEM), Penicillin/Streptomycin (P/S), DMEM (Dulbecco's Modified Eagle Medium).
Abstract. This study investigates the morphological changes and cytopathic effects (CPE) observed in uninfected Human Embryonic Kidney (HEK293T) cell cultures under varying concentrations of fetal bovine serum (FBS) and antibiotics. The primary aim was to determine whether the CPE, typically attributed to viral infections, could be replicated in uninfected cultures by varying the culture environment within normal isolation protocols. HEK293T cells were cultured under different conditions, including various FBS and antibiotic concentrations, and monitored for morphological changes over a period of 3 to 5 days. The results demonstrated that uninfected cultures exhibited significant CPE, such as plaque formation, ballooning, rounding, floating, lifting, and syncytia, similar to those seen in infected cultures. Transmission Electron Microscopy (TEM) analysis revealed the presence of viral-like particles in control cultures, with particles resembling known viruses such as SARS-CoV-2, Measles virus, and HIV based on their size, shape, and protein inclusions. The study also evaluated the impact of seeding density, nutrient verification, and the addition of Amphotericin and human samples on CPE. These findings suggest that the reduced FBS environments commonly used in viral isolation protocols contribute significantly to the observed CPE, challenging the validity of using these morphological changes as definitive indicators of viral presence. The study highlights the need for a critical reassessment of current viral isolation methods and the interpretation of CPE in cell cultures. Future research should focus on elucidating the specific mechanisms by which reduced FBS and varying antibiotic concentrations induce CPE in uninfected cultures and developing alternative methods for viral isolation that do not rely solely on CPE as an indicator.
1 - Introduction
The identification and isolation of viruses in cell cultures often rely on the observation of cytopathic effects (CPE), which include distinct morphological changes such as plaque formation, ballooning, rounding, floating, lifting, and syncytia. These effects are traditionally attributed to viral infection and replication within the cultured cells. However, recent studies have raised questions about the specificity of these indicators, suggesting that similar morphological changes can occur in uninfected cell cultures under certain conditions [1, 2, 3].
This study aims to evaluate the occurrence of CPE in uninfected Human Embryonic Kidney (HEK293T) cell cultures subjected to varying concentrations of fetal bovine serum (FBS) and antibiotics. By systematically altering the culture conditions and monitoring the resulting morphological changes, the study seeks to determine whether the observed CPE can be solely attributed to viral infection or if they can also arise from the culture environment itself.
Additionally, Transmission Electron Microscopy (TEM) was employed to analyze the control cultures for the presence of viral-like particles. TEM provides high-resolution images that can reveal detailed structural features of cells and particles, allowing for a more precise identification of morphological changes and potential viral particles.
The HEK293T cells were cultured in different conditions, including varying FBS and antibiotic concentrations, and observed over a period of 3 to 5 days. The morphological changes were documented and compared to those typically associated with viral infections. TEM analysis was conducted to further investigate the presence of viral-like particles in the control cultures. The findings of the study indicate that uninfected cultures can exhibit significant CPE as well as contain viral-like particles in TEM, challenging the assumption that these effects are exclusive to viral presence. This study highlights the need for a critical reassessment of the methods used in viral isolation and the interpretation of CPE in cell cultures and viral-like particles in TEM.
2 - Hypothesis
The research team hypothesized that the observed CPE in HEK293T cell cultures, typically attributed to viral infections, can be replicated in uninfected cultures through the manipulation of FBS and antibiotic concentrations. They specifically proposed that reduced FBS environments and increased antibiotic concentrations, which mimic the conditions used in viral isolation protocols, will induce morphological changes such as plaque formation, ballooning, rounding, floating, lifting, and syncytia in uninfected cell cultures. This hypothesis challenges the conventional interpretation that these morphological changes are definitive indicators of viral presence and suggests that the culture environment itself may play a significant role in the manifestation of CPE.
3 - Materials and Methods
3.1 - Cell Culture
Human Embryonic Kidney (HEK293T ATCC CRL-3216) cells were seeded onto 6-well culture dishes at passages 5-8 at a concentration of 1x10^6 cells per 5 mL and grown for 3 to 5 days at 37°C in a humidified incubator with 5% CO2. The culture conditions were as follows:
DMEM, 10% FBS, 1x Penicillin/Streptomycin (P/S)
DMEM, 2% FBS, 1x P/S
DMEM, 2% FBS, 2x P/S
DMEM, 2% FBS, 3x P/S
DMEM, 1% FBS, 1x P/S
DMEM, 1% FBS, 2x P/S
DMEM, 1% FBS, 3x P/S
3.2 - Imaging and Cell Harvesting
During day 3-5 of growth, cells were imaged at 10X or 20X magnification using an Evos XL Core Imaging System. Following imaging, cultures were washed with PBS, and 1 mL of TrypLE was added to dissociate cells from the dishes. After 3 minutes, 5 mL of DMEM supplemented with 10% FBS and 1x P/S was added. Cells were then harvested and centrifuged at 1000 rpm for 3 minutes. The cell pellets were resuspended in 5 mL of DMEM with 10% FBS and 1x P/S, and cell viability was calculated using a Countess 3 FC Automated Cell Counter (Invitrogen).
3.3 - Cell Pellet Processing
After recording viability, cells were centrifuged at 1000 rpm for 3 minutes. The DMEM was decanted, and the cell pellet was resuspended in 300-500 µL of TRIzol and stored at -80°C until further analysis.
3.4 - Laboratory Setup and Reagent Handling
The laboratory setting was documented, including the flow hood calibrated to protocol settings to prevent contamination. Stock of all reagents was taken, showing the cell line, DMEM, FBS, Pen/Strep, Amphotericin, TRIzol, Trypsin, and a selection of pipettes and tips.
3.5 - Trypsinization and Cell Counting
Cells were trypsinized to detach adherent cells from the culture vessel surface before counting and seeding. The following materials were used:
Trypsin-EDTA solution (commonly 0.25%)
Phosphate-Buffered Saline (PBS) or another balanced salt solution
Cell culture medium (with serum to inactivate trypsin)
Hemocytometer or automated cell counter
Centrifuge
Sterile pipettes
Culture flasks or dishes
After trypsinization, cells were verified under a microscope to ensure detachment and free movement. The cell suspension was centrifuged to form a pellet, which was then resuspended for counting using the Countess 3 FC Automated Cell Counter.
3.6 - Seeding and Plating
Cells were seeded into 6-well plates at a concentration of 1x10^6 cells per 5 mL per well. Additional culture medium was added to each well to reach the desired volume. Plates were incubated for 3 to 4 days at 37°C in a humidified incubator with 5% CO2. The following conditions were tested:
DMEM, 10% FBS, 1x P/S
DMEM, 2% FBS, 1x P/S
DMEM, 2% FBS, 2x P/S
DMEM, 2% FBS, 3x P/S
DMEM, 1% FBS, 1x P/S
DMEM, 1% FBS, 2x P/S
DMEM, 1% FBS, 3x P/S
3.7 – Cell Culture Observation and Analysis
Plates were examined under a microscope to verify the growth and morphology of cells. Negative control plates with 10% FBS were compared to test plates with varying FBS and antibiotic concentrations. Morphological changes such as plaque formation, ballooning, rounding, floating, lifting, and syncytia were documented. The viability and confluence of cells were assessed, and any CPE were noted.
3.8 – TEM Sample Preparation
The preparation of samples for Transmission Electron Microscopy (TEM) involved several meticulous steps to ensure high-quality imaging. Initially, the cell culture samples were fixed in 2.5% glutaraldehyde in phosphate-buffered saline (PBS) for 2 hours at room temperature to preserve cellular structures. Following fixation, the samples underwent dehydration through a graded ethanol series (30%, 50%, 70%, 90%, and 100%) to remove water content. The dehydrated samples were then embedded in epoxy resin to provide a solid matrix for sectioning. Ultrathin sections (70-90 nm) were cut using an ultramicrotome and subsequently stained with uranyl acetate and lead citrate to enhance contrast and visualize cellular details under the TEM.
3.9 – TEM Imaging and Analysis
TEM imaging was conducted using a JEOL JEM-1400 Plus Transmission Electron Microscope at an accelerating voltage of 80 kV, capturing images at magnifications ranging from 10,000X to 50,000X. The cell culture sample was prepared through fixation in 2.5% glutaraldehyde, dehydration in a graded ethanol series, embedding in epoxy resin, and sectioning into ultrathin slices (70-90 nm). These sections were stained with uranyl acetate and lead citrate to enhance contrast. Image analysis was performed using ImageJ software, focusing on identifying and measuring viral-like particles and extracellular vesicles.
4 – Results
4.1 – Cell Culture Images - Experiments 1 to 9
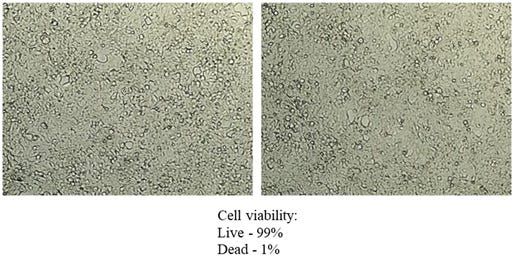
Experiment 1
Negative Control

Test

Figure 2: A: HEK 293T Day 5 DMEM 10%FBS, B: HEK 293T Day 5 DMEM 2%FBS, C: HEK 293T Day 5 DMEM 2%FBS. A, B and C 10x magnification.
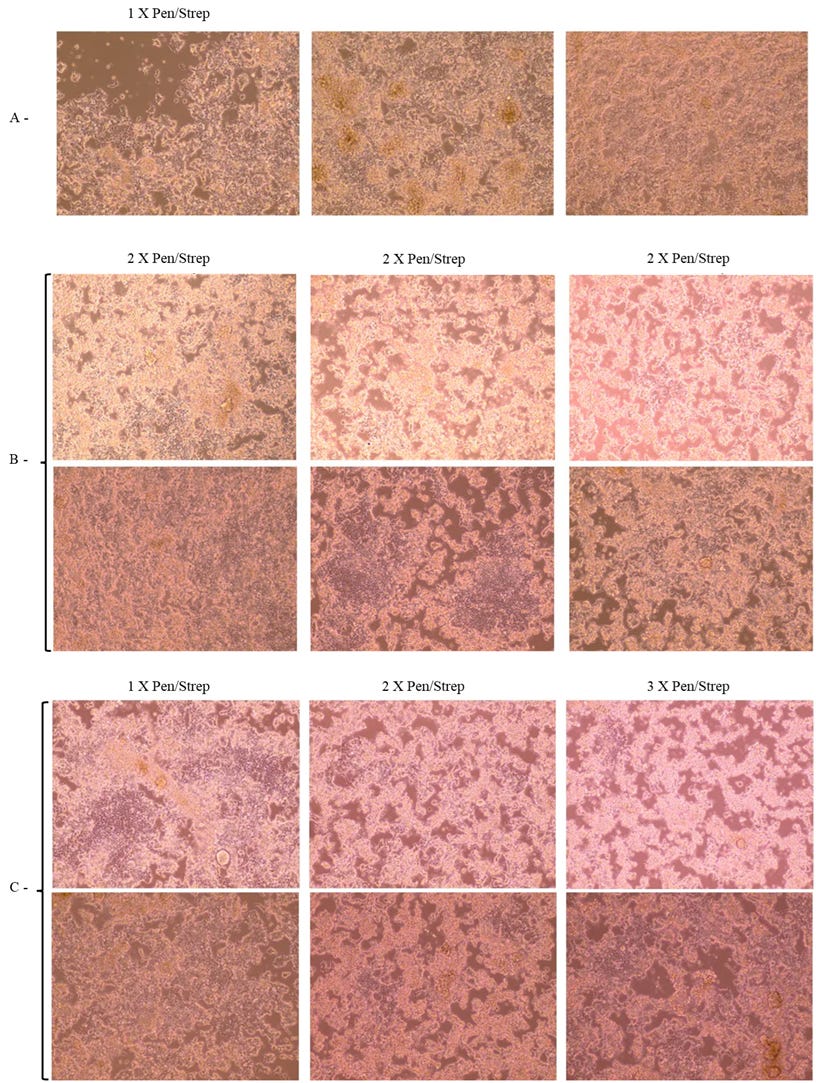
Experiment 2
Negative Control

Figure 3: HEK 293T Day 3 DMEM 10%FBS, 1x P/S. 10x magnification. Test
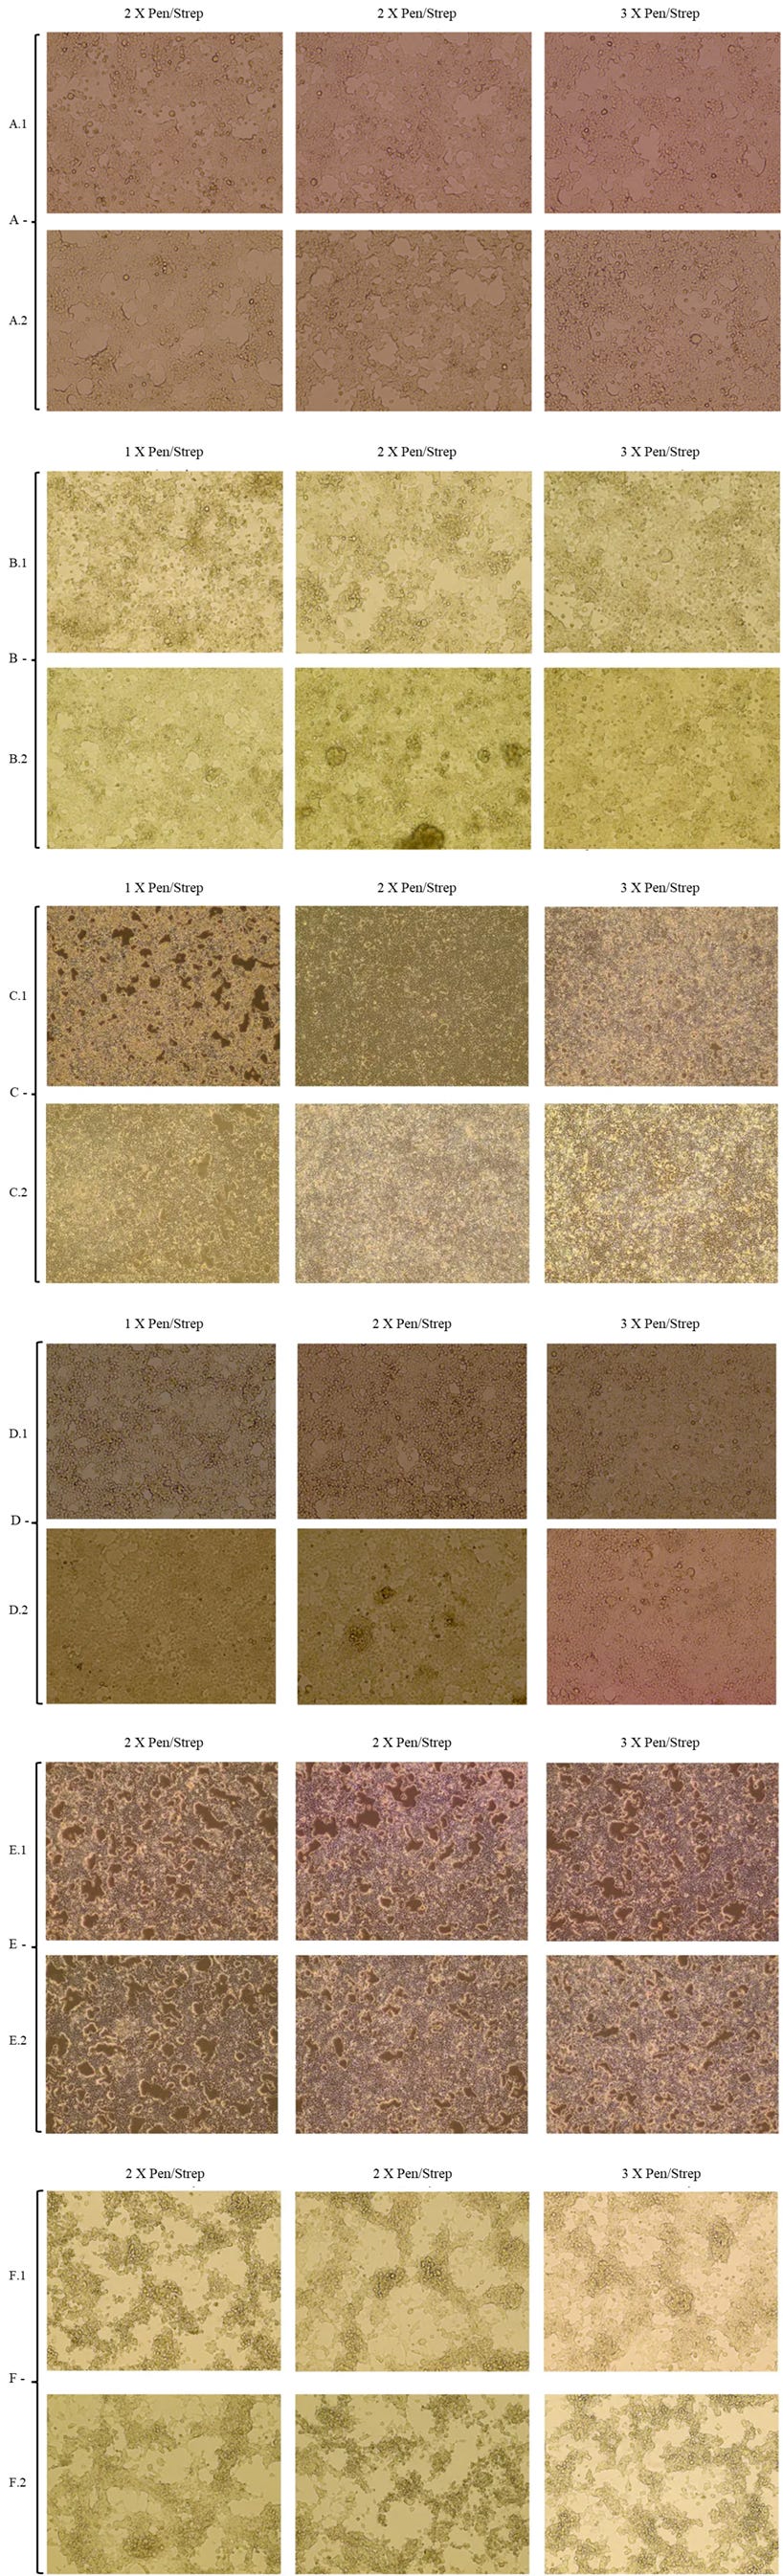
Figure 4: A: HEK 293T Day 3 DMEM 1%FBS (A.2: 10% media from Exp 1), B: HEK 293T Day 5 DMEM 2%FBS (B.2: 10% media from Exp 1), C: HEK 293T Day 3 DMEM 2%FBS (C.2: 10% media from Exp 1), D: HEK 293T Day 3 DMEM 2%FBS (D.2: 10% media from Exp 1), E: HEK 293T Day 3 DMEM 1%FBS (E.2: 10% media from Exp 1), F: HEK 293T Day 5 DMEM 1%FBS (F.2: 10% media from Exp 1). C, E 10x magnification. A, B, D and F 20x magnification.


Experiment 3
Negative Control

Figure 5: HEK 293T Day 3 DMEM 10%FBS, 1x P/S. 20x magnification. Test


Experiment 4
Negative Control

Figure 7: HEK 293T Day 3 DMEM 10%FBS, 1x P/S. 20x magnification. Test
Figure 8: A: HEK 293T Day 3 DMEM 2%FBS, B: HEK 293T Day 3 DMEM 1%FBS. A, B 20x magnification.

Experiment 5
Negative Control

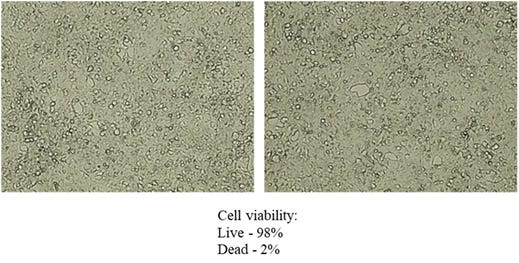
Figure 9: HEK 293T Day 4 DMEM 10%FBS, 1x P/S. 20x magnification. Test
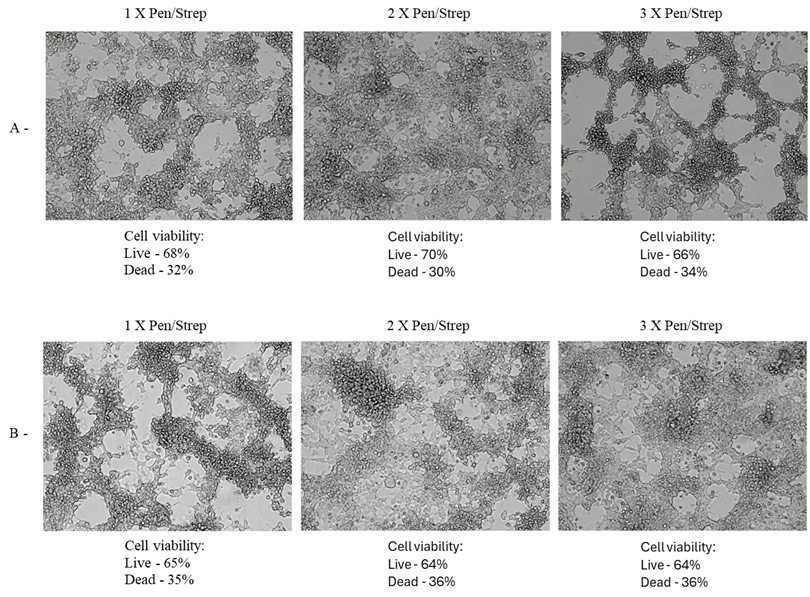
Figure 10: A: HEK 293T Day 4 DMEM 2%FBS, B: HEK 293T Day 4 DMEM 1%FBS. A, B 20x magnification.


Experiment 6
Negative Control

Figure 11: HEK 293T Day 4 DMEM 10%FBS, 1x P/S. 20x magnification. Test
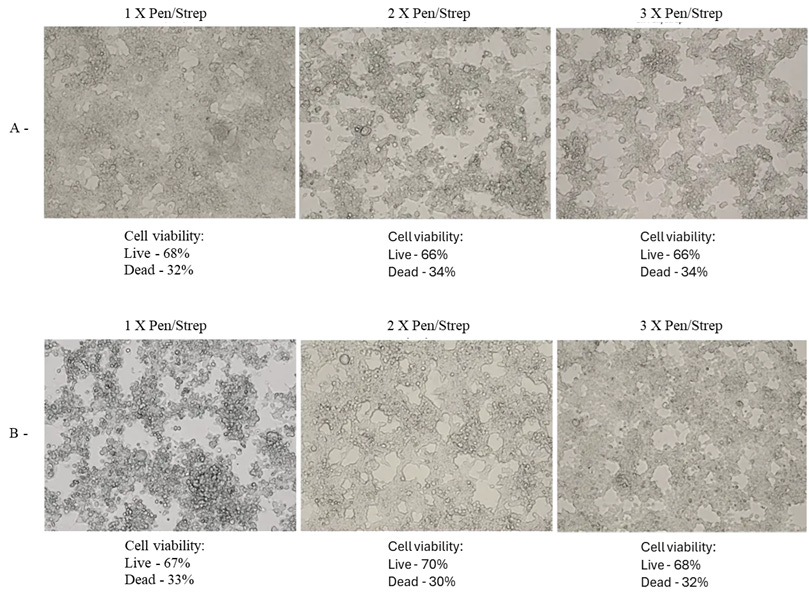
Figure 12: A: HEK 293T Day 4 DMEM 1%FBS, B: HEK 293T Day 4 DMEM 2%FBS. A, B 20x magnification.


Experiment 7
Negative Control

Figure 13: HEK 293T Day 4 DMEM 10%FBS, 1x P/S. Cells normally growing, near confluent. 20x magnification. Test
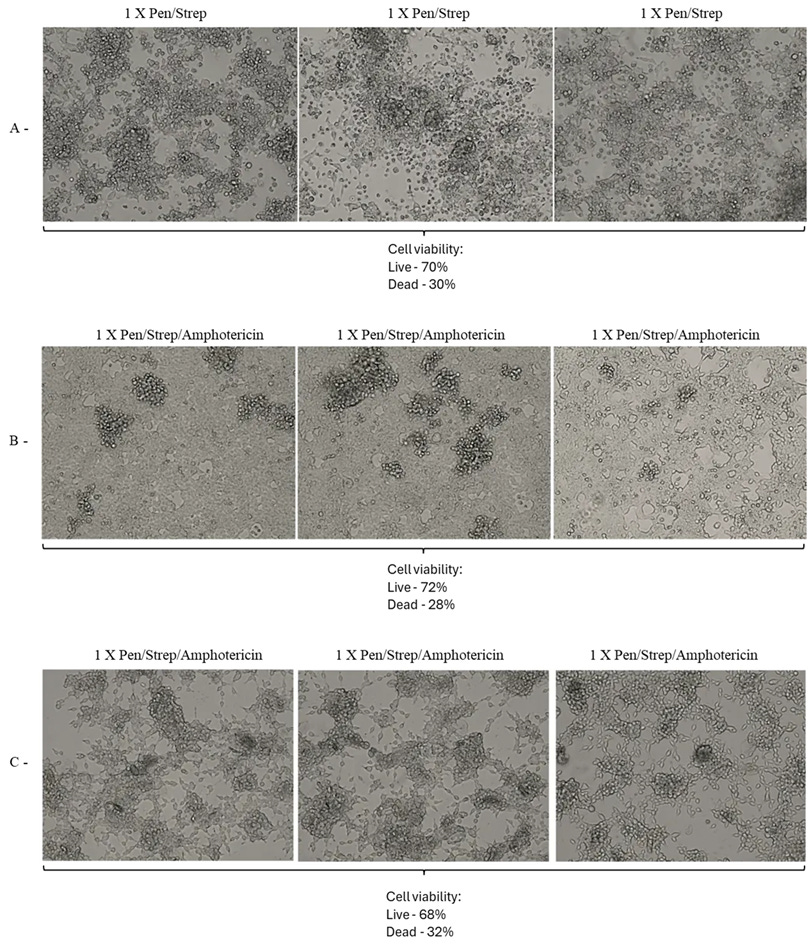
Figure 14: A: 1X Pen/Strep, HEK 293T Day 4 DMEM 2%FBS (Cells dying, many floating. Apoptosis, cytopathic effect and syncytia observed), B: 1X Pen/Strep/Amphotericin, HEK 293T Day 4 DMEM 2%FBS (Some cells dying/lifting/floating. Cells near confluence, growing “ok.” CPE/apoptosis/syncytia observed), C: 1X Pen/Strep/Amphotericin, HEK 293T Day 4 DMEM 2%FBS + 350ul Sputum (Cells dying/lifting/floating. Cells other than HEK observed, likely from sputum. CPE/apoptosis/syncytia observed). A, B and C 20x magnification.

Experiment 8
Negative Control

Figure 15: HEK 293T Day 4 DMEM 10%FBS, 1x P/S. Cells normally growing, near confluent. 20x magnification. Test

Figure 16: A: 1X Pen/Strep, HEK 293T Day 4 DMEM 2%FBS (Cells dying, many floating. Apoptosis, cytopathic effect and syncytia observed), B: 1X Pen/Strep/Amphotericin, HEK 293T Day 4 DMEM 2%FBS (Many cells dying/lifting/floating. CPE/apoptosis/syncytia observed), C: 1X Pen/Strep/Amphotericin, HEK 293T Day 4 DMEM 2%FBS + 350ul Sputum (Cells dying/lifting/floating. Cells other than HEK observed, likely from sputum. CPE/apoptosis/syncytia observed). A, B and C 20x magnification.
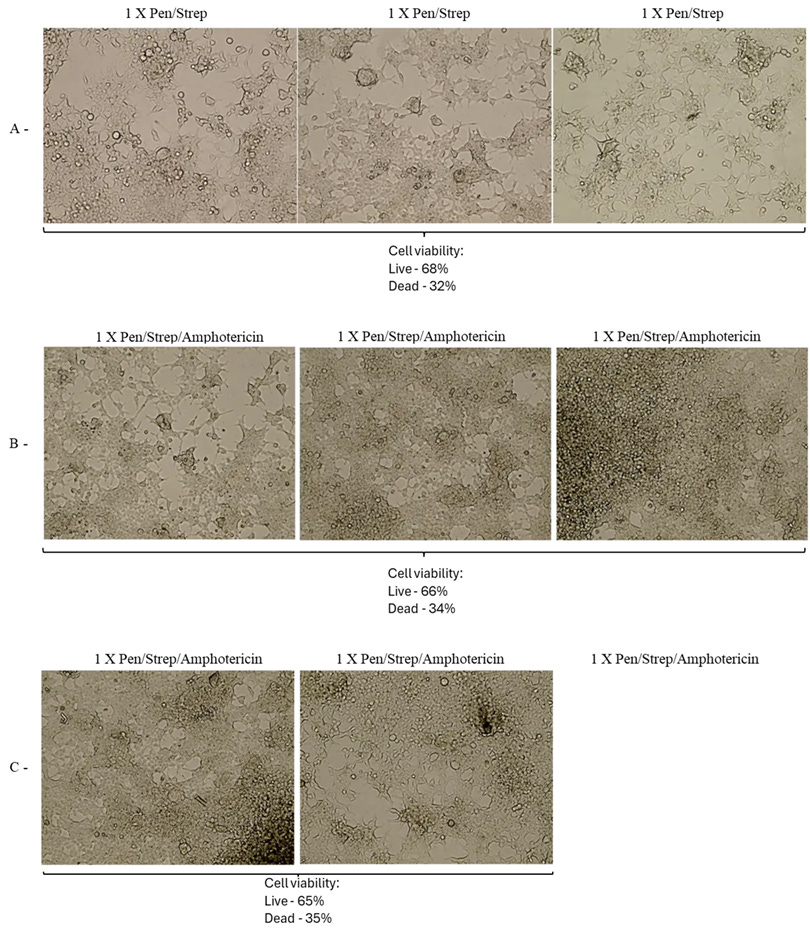
Experiment 9
Negative Control

Figure 17: HEK 293T Day 4 DMEM 10%FBS, 1x P/S. Cells normally growing, near confluent. 20x magnification. Test

Figure 18: A: 1X Pen/Strep, HEK 293T Day 4 DMEM 2%FBS (Cells dying, many floating. Apoptosis, cytopathic effect and syncytia observed), B: 1X Pen/Strep/2X Amphotericin, HEK 293T Day 4 DMEM 2%FBS (Many cells dying/lifting/floating. CPE/apoptosis/syncytia observed), C: 1X Pen/Strep/2X Amphotericin, HEK 293T Day 4 DMEM 2%FBS + 350ul Sputum (Cells dying/lifting/floating. Cells other than HEK observed, likely from sputum. CPE/apoptosis/syncytia observed). A, B and C 20x magnification.

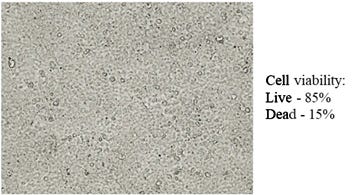
4.2 - Cell Viability and Confluence
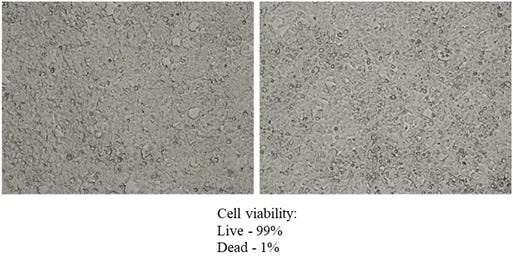
The negative control cultures, maintained in DMEM with 10% FBS and 1x P/S, exhibited healthy growth with confluence levels between 85-99%. No significant apoptosis or breakdown of the cell line was observed within the 5-day incubation period. Past day 5 of incubation it may have become difficult to maintain this level of confluence, running the risk of the cell line starting to break down due to overgrowing, contact inhibition and starvation. Hence the tests were only undertaken to a maximum of 5-day incubations, despite many protocols of Viral Isolation exceeding this time period.
4.3 - Cytopathic Effects (CPE)
All test cultures demonstrated significant CPE, including plaque formation, ballooning, rounding, floating, lifting, and syncytia. These effects were observed as early as 48 hours into incubation and increased over time. The extent of CPE ranged from approximately 10% to 40% cell death, as measured by the Countess Cell viability counter.
4.4 - Impact of FBS and Antibiotic Concentrations
2% FBS, 1x P/S: Cultures exhibited clear plaques, clumping, syncytia, and numerous floating dead cells. The morphology was significantly different from the negative control, with notable cytopathic effects.
2% FBS, 2x P/S: Similar to the 2% FBS, 1x P/S condition, with additional ballooning and dead cells. The morphological features aligned with those described in other studies showing CPE.
2% FBS, 3x P/S: Increased antibiotic concentration did not significantly alter the extent of CPE compared to the 2x P/S condition.
1% FBS, 1x P/S: Cultures showed increased CPE, with more pronounced morphological changes, including rounding and syncytia.
1% FBS, 2x P/S: Similar to the 1% FBS, 1x P/S condition, with additional ballooning and dead cells.
1% FBS, 3x P/S: The highest antibiotic concentration did not significantly increase CPE compared to the 2x P/S condition.
4.5 - Seeding Density and Nutrient Verification
Verification tests with half the seeding density (0.5 million cells per 5 mL) showed similar CPE to the test cultures, ruling out over growing of cells or contact inhibition as contributing factors. The red color of the culture medium at later stages of incubation indicated a sufficient supply of DMEM, further supporting that nutrient depletion was not responsible for the observed cell death.
4.6 - Comparison with Positive Controls
The test cultures exhibited CPE at the same speed and severity as the positive controls, with all distinguishing morphological features of CPE observed. Images from published work were used to act as a positive control [2, 3], and the findings of this experiment were not reliant on a benchmark of other protocols. This comparison included detailed analysis of morphological features such as plaque formation, ballooning, rounding, floating, lifting, and syncytia.
4.7 – Addition of Amphotericin
Amphotericin, an antifungal agent, was added to the HEK293T cultures at varying concentrations alongside different levels of P/S to investigate its potential influence on CPE. Results indicated that the addition of Amphotericin had a negligible impact on the observed CPE. The morphological changes, including plaque formation, ballooning, rounding, and syncytia, were consistent with those observed in cultures without Amphotericin.
Notably, in some plates—particularly those with higher Amphotericin concentrations—an increase in CPE (approximately 10%) was recorded by the Countess viability counter. However, imaging analysis revealed no significant morphological differences between these plates and others, suggesting potential variability in automated counting accuracy rather than a genuine experimental effect.
The findings further support the conclusion that the primary drivers of CPE in this study are the reduced FBS environments and altered antibiotic concentrations, rather than the addition of Amphotericin itself. Future studies could explore broader ranges of antifungal concentrations to confirm these findings across diverse conditions.
4.8 – Addition of Cell Culture Medium
In Experiment 2, 10% of the culture medium was used to "infect" the culture. This was to evaluate the type of Plaque Assay, such as the Tissue Culture Infectious Dose 50 (TCID₅₀) in serial dilution. Despite only one dilution being performed, there was a noted change in the cell line that slightly increased the observed CPE and also introduced some distinct morphological CPE features such as syncytia, most notably observed on Day 3 and Day 5 in the 2% FBS condition. If this dilution were to be serially performed, it is implied that those formations and observed CPE would become increasingly more apparent, although further research is needed in this area.
4.9 - Human Sample Comparison
A biological sample from a healthy human donor was introduced into the HEK293T cell line to evaluate its potential influence on observed CPE. The introduction of this sample did not significantly alter the extent or nature of CPE observed in the cultures. Morphological features such as plaque formation, ballooning, rounding, floating, lifting, and syncytia remained consistent with those noted in test cultures without the human sample.
These findings suggest that the observed effects were intrinsic to the experimental conditions, specifically the reduced FBS environments and antibiotic variations, rather than being influenced by external biological contaminants from the human sample. This underscores the need for stringent control setups in virological studies to eliminate environmental variables as confounding factors.
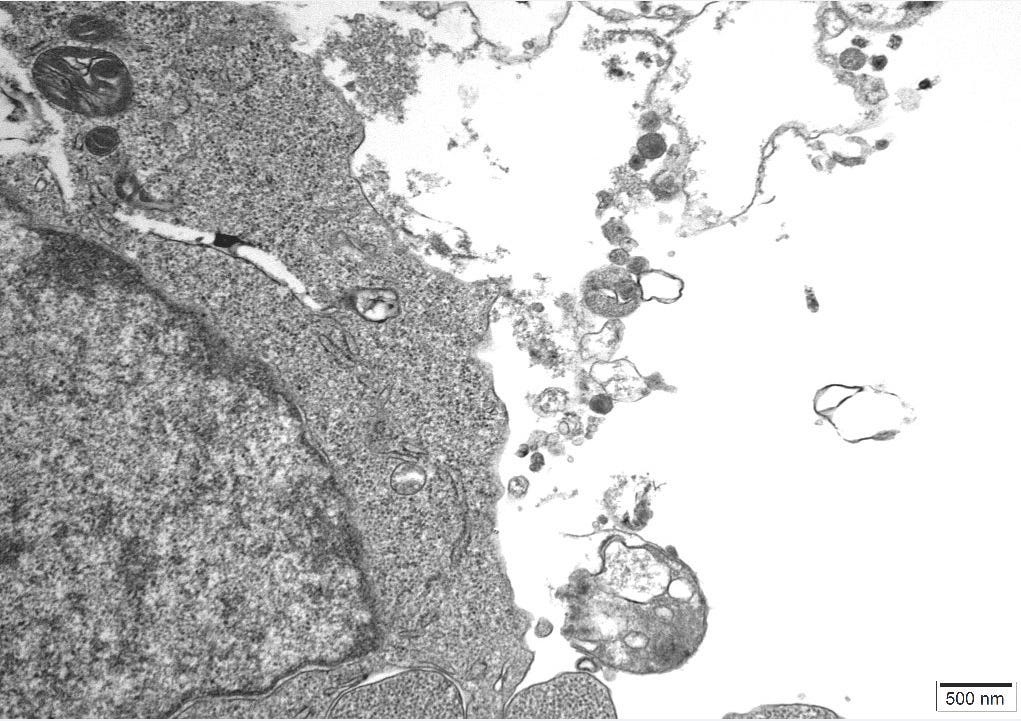
4.10 – Transmission Electron Microscopy
An independent Contract Research Organization (CRO) was requested to conduct Transmission Electron Microscopy (TEM) on one of the control cultures. All images obtained can be reviewed in Appendix A.
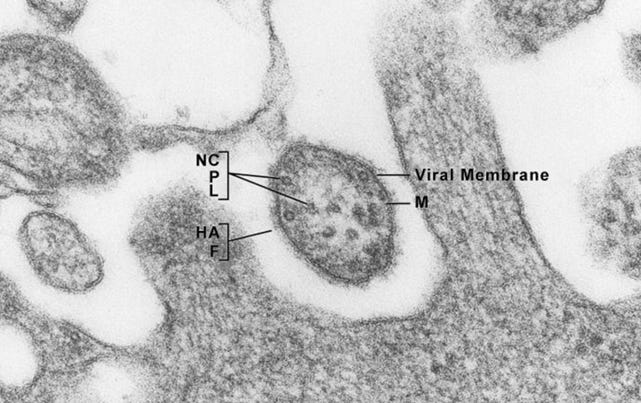
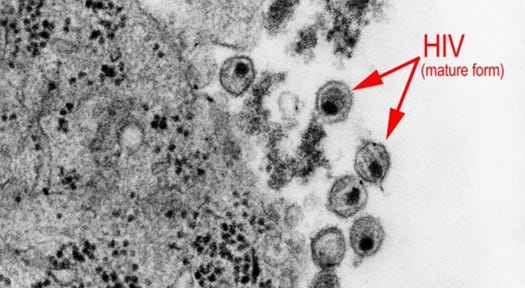
The images were inspected to consider the sizes, proteomic description and characteristics of what the CDC considers to be Sars Cov 2, Measles and HIV virus and the defining features of these particles could be cross-referenced to particles in the control cultures.
The size and overall shape are two distinctive features which were positively identified and particularly in the case of Measles Virus there is very little explanation as to what else this particle could be, when found in uninfected cultures.


4.11 – TEM Results
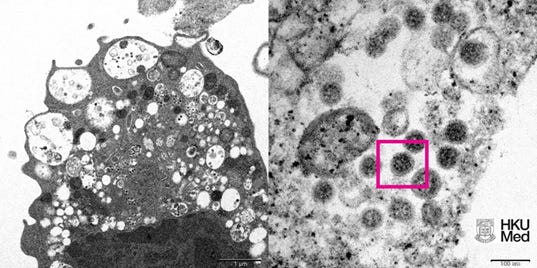
The TEM analysis of the control cultures revealed the presence of viral-like particles and extracellular vesicles. Nine images were provided by the CRO (refer to Appendix A), showing various structures within the cell cultures. Notably, particles resembling known viruses such as SARS-CoV-2, Measles virus, and HIV were identified based on their size, shape, and protein inclusions, particularly in images 5 and 9.
4.12 - Summary of Findings
The results indicate that uninfected HEK293T cell cultures in reduced FBS environments and varying antibiotic concentrations exhibit significant CPE, challenging the assumption that these effects are exclusive indicators of viral presence. The findings suggest that the culture environment itself plays a significant role in the manifestation of CPE, necessitating a reassessment of current viral isolation protocols.
5 - Discussion
The results of this study challenge the conventional interpretation of cytopathic effects (CPE) as definitive indicators of viral presence in cell cultures. The findings demonstrate that uninfected HEK293T cell cultures, when subjected to reduced FBS concentrations and varying antibiotic levels, exhibit significant CPE similar to those observed in infected cultures. This raises important questions about the validity of using CPE as a sole criterion for viral isolation and identification.
5.1 - Impact of FBS and Antibiotic Concentrations
The observed CPE in uninfected cultures under reduced FBS conditions suggests that nutrient deprivation plays a critical role in inducing morphological changes traditionally attributed to viral infections. The varying concentrations of antibiotics, particularly P/S, further influenced the extent of CPE, indicating that the culture environment itself can significantly impact cell viability and morphology. These findings align with previous studies that have reported similar effects in nutrient-deprived environments [7], highlighting the need for careful consideration of culture conditions in virological studies.
5.2 - Comparison with Positive Controls
The test cultures exhibited cytopathic effects (CPE) at the same speed and severity as the positive controls, with all distinguishing morphological features of CPE observed. Images from published work were used to act as a positive control [5, 6], and the findings of this experiment were not reliant on a benchmark of other protocols. This comparison included detailed analysis of morphological features such as plaque formation, ballooning, rounding, floating, lifting, and syncytia.
In the experiments, it was observed that the test cultures, under varying conditions of FBS and antibiotic concentrations, displayed CPE that closely matched the images of positive controls from published studies. For instance, the plaques and syncytia observed in the 2% FBS and 2x Pen/Strep condition were indistinguishable from those documented in the positive control images. This visual confirmation was further supported by quantitative measurements, where the extent of CPE in the cultures often exceeded that of the positive controls.
The positive control images included both "transfected" and "infected" cultures with adenoviruses, taken under the same conditions as the test cultures. Despite the presence of what was considered "purified" virus or genetic material of viruses, the amount of observable CPE was similar to or even less than that observed in the uninoculated cultures. This comparison demonstrated that the addition of a biological sample presumed to contain pathogenic viruses did not cause a significant increase in CPE, reinforcing the hypothesis that the culture environment, rather than viral presence, is responsible for the observed effects.
The meticulous comparison of the test culture images with those of positive controls adds significant weight to the findings. This underscores the importance of including appropriate negative controls and conducting thorough image comparisons in virological experiments to accurately interpret the results.
5.3 - Seeding Density and Nutrient Verification
Verification tests with half the seeding density showed similar CPE to the test cultures, ruling out overgrowing of cells or contact inhibition as contributing factors. The red color of the culture medium at later stages of incubation indicated a sufficient supply of DMEM, further supporting that overgrowing of cells was not responsible for the observed cell death.
5.4 - Implications for Viral Isolation Protocols
The strong evidence presented in this study suggests that the reduced FBS environments commonly used in viral isolation protocols may be the primary cause of the observed CPE and morphological features. This challenges the assumption that these effects are exclusive indicators of viral presence and calls for a reassessment of current viral isolation methods. The findings indicate that claimed isolated and replicated viruses, assumed to be harvested from the cell culture isolation method, should not be considered legitimate if the observed effects can be replicated in uninfected cultures.
5.5 – TEM Findings on Uninoculated Cultures
The TEM findings provide significant insights into the morphological changes observed in the cell culture, revealing the presence of viral-like particles. Particles resembling SARS-CoV-2, Measles virus, and HIV were identified based on their size, shape, and protein inclusions, suggesting that these structures may not be exclusive indicators of viral presence. This further confirms the findings of other studies [20] that concluded:
“The remarkable resemblance between EVs and viruses has caused quite a few problems in the studies focused on the analysis of EVs released during viral infections. Nowadays, it is an almost impossible mission to separate EVs and viruses by means of canonical vesicle isolation methods, such as differential ultracentrifugation, because they are frequently co-pelleted due to their similar dimension.”
These findings further challenge the conventional interpretation of CPE and highlight the need for a critical reassessment of current viral isolation protocols. The TEM analysis underscores the importance of considering the morphology of extracellular vesicles, suggesting that what are often labeled as pathogenic viruses could be misinterpreted cellular debris or non-pathogenic entities.
5.6 - Future Research Directions
Further research is needed to explore the specific mechanisms by which reduced FBS and varying antibiotic concentrations induce CPE in uninfected cultures. Investigating the role of other culture conditions, such as different cell lines and nutrient media, will provide a more comprehensive understanding of the factors influencing CPE. Additionally, developing alternative methods for viral isolation that do not rely solely on CPE as an indicator will enhance the accuracy and reliability of virological studies.
In conclusion, this study highlights the critical need for a reassessment of the methods used in viral isolation and the interpretation of CPE in cell cultures. The findings underscore the importance of considering the culture environment's impact on cell viability and morphology, challenging the traditional reliance on CPE as definitive evidence of viral presence.
6 - Conclusion
This study provides compelling evidence that the CPE observed in HEK293T cell cultures can be induced in the absence of viral infection through varying FBS concentrations and antibiotic levels. The findings challenge the traditional reliance on CPE as definitive indicators of viral presence and suggest that the culture environment itself plays a significant role in the manifestation of these effects.
The results demonstrated that uninfected cultures subjected to reduced FBS environments and varying concentrations of P/S exhibited significant CPE, including plaque formation, ballooning, rounding, floating, lifting, and syncytia. These effects were observed as early as 48 hours into incubation and increased over time, with cell death ranging from approximately 10% to 40%. The similarity in CPE between the test cultures and positive controls further supports the hypothesis that the observed effects are not exclusive to viral infections.
Verification tests with different seeding densities and nutrient conditions ruled out the overgrowing of cells and contact inhibition as contributing factors, reinforcing the conclusion that the culture environment is a critical determinant of CPE. The findings underscore the need for a reassessment of current viral isolation protocols, which often rely on reduced FBS environments that may themselves induce CPE.
The study highlights the importance of including appropriate negative controls in virological experiments to accurately interpret the results. The evidence suggests that claimed isolated and replicated viruses, assumed to be harvested from the cell culture isolation method, should not be considered legitimate if the observed effects can be replicated in uninfected cultures.
The TEM findings further highlight the lack of a robust standard that could rule out doubt that the cell culture experiment itself creates artifacts that are mistaken for virus like particles in the TEM.
Future research should focus on elucidating the specific mechanisms by which reduced FBS and varying antibiotic concentrations induce CPE in uninfected cultures. Additionally, developing alternative methods for viral isolation that do not rely solely on CPE as an indicator will enhance the accuracy and reliability of virological studies.
In conclusion, this study challenges the conventional interpretation of CPE as definitive evidence of viral presence and calls for a critical reassessment of the methods used in viral isolation. The findings emphasize the need to consider the impact of the culture environment on cell viability and morphology, ensuring more accurate and reliable virological research.
7 – Acknowledgements
We would like to express our gratitude to the laboratory staff and technicians who provided invaluable assistance in the preparation and execution of the experiments detailed in this study. Special thanks to the CRO technician for meticulously documenting the laboratory procedures and ensuring adherence to contamination prevention protocols.
We also acknowledge the contributions of Jamie Andrews and his team from The Virology Controls Studies Project for their critical feedback and support throughout the research process. Their insights and expertise were instrumental in refining our methodology and interpreting the results.
We also acknowledge the contributions of the individuals who provided critical feedback and support throughout the research process. Their insights and expertise were instrumental in refining our methodology and interpreting the results.
Finally, we are grateful to the readers and supporters of The Virology Controls Studies Project for their support to the project. Their commitment to advancing scientific knowledge and challenging established paradigms has been a driving force behind this research.
Thank you to all who have contributed to this study. Your efforts and dedication have been invaluable.
References
Andrews, J. (2025, January 4). LABORATORY VIDEO DOCUMENTATION OF CONTROL EXPERIMENTS. Substack. Retrieved from https://controlstudies.substack.com/p/laboratory-video-documentation-of
Andrews, J. (2025, January 4). CELL CULTURE ISOLATION CONTROL EXPERIMENT. Substack. Retrieved from
https://controlstudies.substack.com/p/cell-culture-isolation-control-experiment
Andrews, J. (2025, January 25). TRANSMISSION ELECTRON MICROSCOPY OF CONTROL CULTURES. Substack. Retrieved from
https://controlstudies.substack.com/p/transmission-electron-microscopy
Nicholls, J., Peiris, M., & Poon, L. (2021, December 8). HKUMED REVEALS THE ELECTRON MICROSCOPE IMAGE OF SARS-COV-2 OMICRON VARIANT. The University of Hong Kong. Retrieved from https://www.med.hku.hk/en/news/press/20211208-omicron-microscope-image
Mahy, B. W. J. (n.d.). TRANSMISSION ELECTRON MICROSCOPIC (TEM) IMAGE OF A MEASLES VIRUS PARTICLE. Public Health Image Library (PHIL), Centers for Disease Control and Prevention (CDC). Retrieved from https://phil.cdc.gov/Details.aspx?pid=12733
Centers for Disease Control and Prevention (CDC). (n.d.). TRANSMISSION ELECTRON MICROSCOPIC (TEM) IMAGE OF MATURE FORMS OF THE HUMAN IMMUNODEFICIENCY VIRUS (HIV). Public Health Image Library (PHIL). Retrieved from https://phil.cdc.gov/Details.aspx?pid=8254
Lanka, S. (2022). CONTROL EXPERIMENT PHASE 1 - SEVERAL LABORATORIES CONFIRM THE REFUTATION OF VIROLOGY BY THE CYTOPATHIC EFFECT. Corona_Fakten. Retrieved from:
ResearchGate. (2025). ISOLATION OF NOVEL SIMIAN ADENOVIRUSES FROM MACAQUES FOR DEVELOPMENT OF A VECTOR FOR HUMAN GENE THERAPY AND VACCINES. Retrieved January 19, 2025, from https://www.researchgate.net/publication/373973300_Isolation_of_novel_simian_adenoviruses_from_macaques_for_development_of_a_vector_for_human_gene_therapy_and_vaccines
Takara Bio. (2025). ADENOVIRUS PURIFICATION MEGA-SCALE PROTOCOL. Retrieved January 19, 2025, from https://www.takarabio.com/learning-centers/gene-function/viral-transduction/adenovirus/adenovirus-purification-mega-scale
American Society of Microbiology. (2024). GUIDELINES FOR CYTOPATHIC EFFECT OBSERVATION IN CELL CULTURES. Retrieved from https://asm.org/Guidelines/Cytopathic-Effect-Observation
Invitrogen. (2025). COUNTESS 3 FC AUTOMATED CELL COUNTER USER MANUAL. Thermo Fisher Scientific. Retrieved from https://www.thermofisher.com/order/catalog/product/AMQAF1000
ATCC. (2025). HUMAN EMBRYONIC KIDNEY (HEK293T) CELL LINE (ATCC CRL-3216). American Type Culture Collection. Retrieved from https://www.atcc.org/products/crl-3216
Thermo Fisher Scientific. (2025). DMEM (DULBECCO'S MODIFIED EAGLE MEDIUM) PRODUCT INFORMATION. Retrieved from https://www.thermofisher.com/order/catalog/product/11965092
Sigma-Aldrich. (2025). FETAL BOVINE SERUM (FBS) PRODUCT INFORMATION. Retrieved from https://www.sigmaaldrich.com/catalog/product/sigma/f2442
Sigma-Aldrich. (2025). PENICILLIN-STREPTOMYCIN (P/S) SOLUTION PRODUCT INFORMATION. Retrieved from https://www.sigmaaldrich.com/catalog/product/sigma/p4333
Thermo Fisher Scientific. (2025). TRIZOL REAGENT PRODUCT INFORMATION. Retrieved from https://www.thermofisher.com/order/catalog/product/15596026
Thermo Fisher Scientific. (2025). TRYPLE EXPRESS ENZYME (1X), NO PHENOL RED. Retrieved from https://www.thermofisher.com/order/catalog/product/12605010
Sigma-Aldrich. (2025). AMPHOTERICIN B PRODUCT INFORMATION. Retrieved from https://www.sigmaaldrich.com/catalog/product/sigma/a2942
Invitrogen. (2025). EVOS XL CORE IMAGING SYSTEM USER MANUAL. Thermo Fisher Scientific. Retrieved from https://www.thermofisher.com/order/catalog/product/AMG1000
Zhu, N., Zhang, D., Wang, W., Li, X., Yang, B., Song, J., ... & Tan, W. (2020). A NOVEL CORONAVIRUS FROM PATIENTS WITH PNEUMONIA IN CHINA, 2019. The New England Journal of Medicine, 382(8), 727-733. doi:10.1056/NEJMoa2001017. Retrieved from https://pmc.ncbi.nlm.nih.gov/articles/PMC7291340/
Appendix A – Transmission Electron Microscopy
Image 1
Image 2
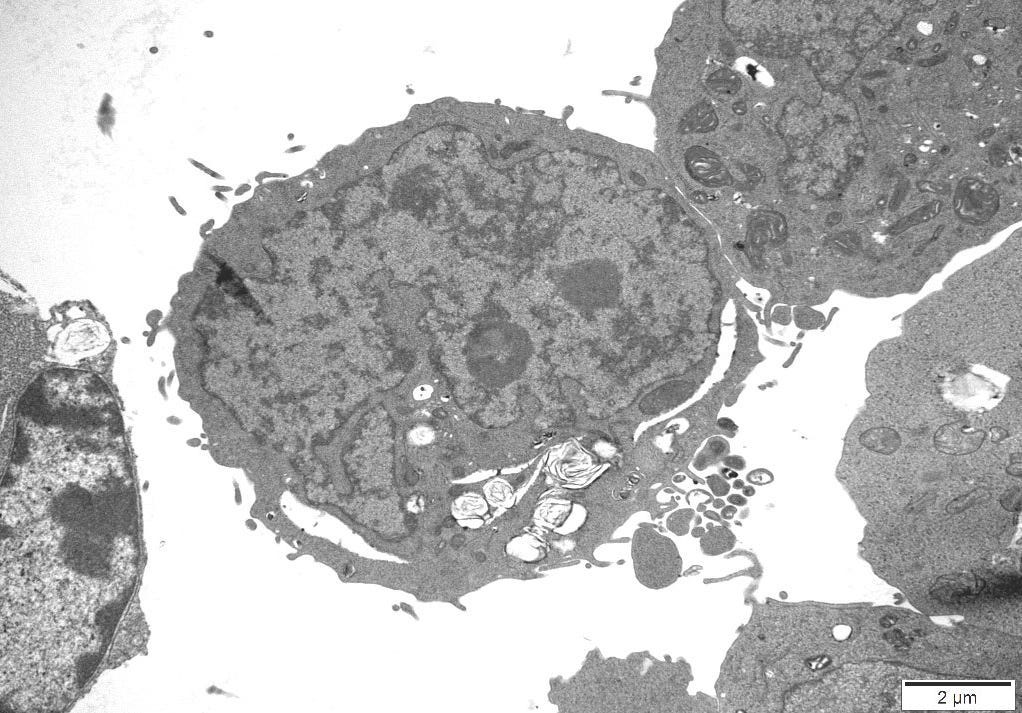
Image 3
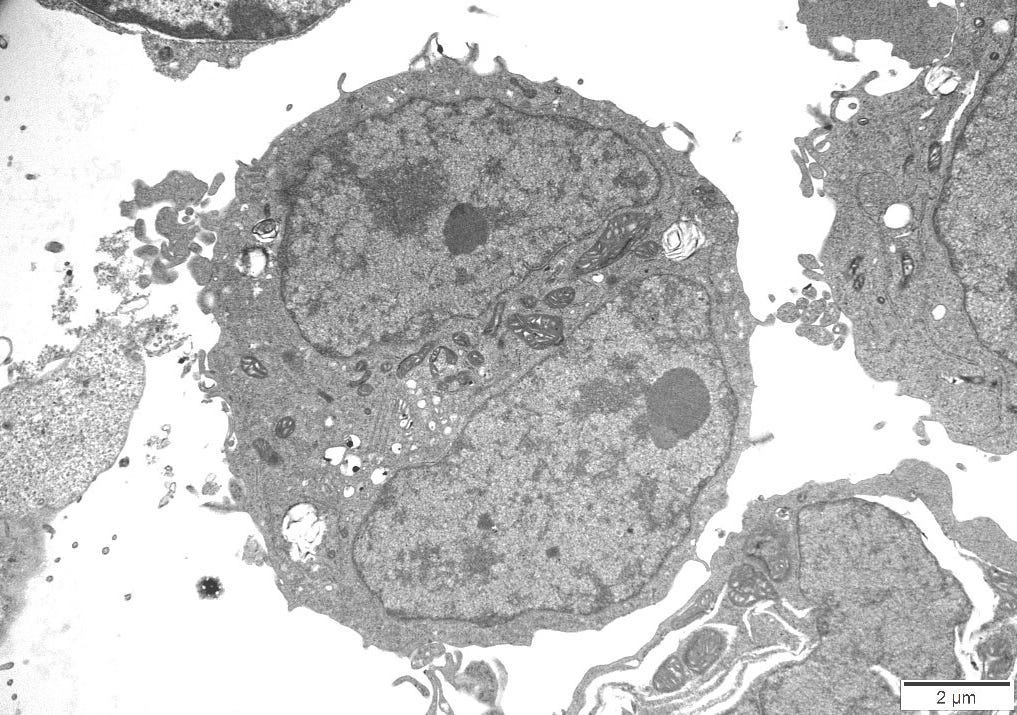
Image 4
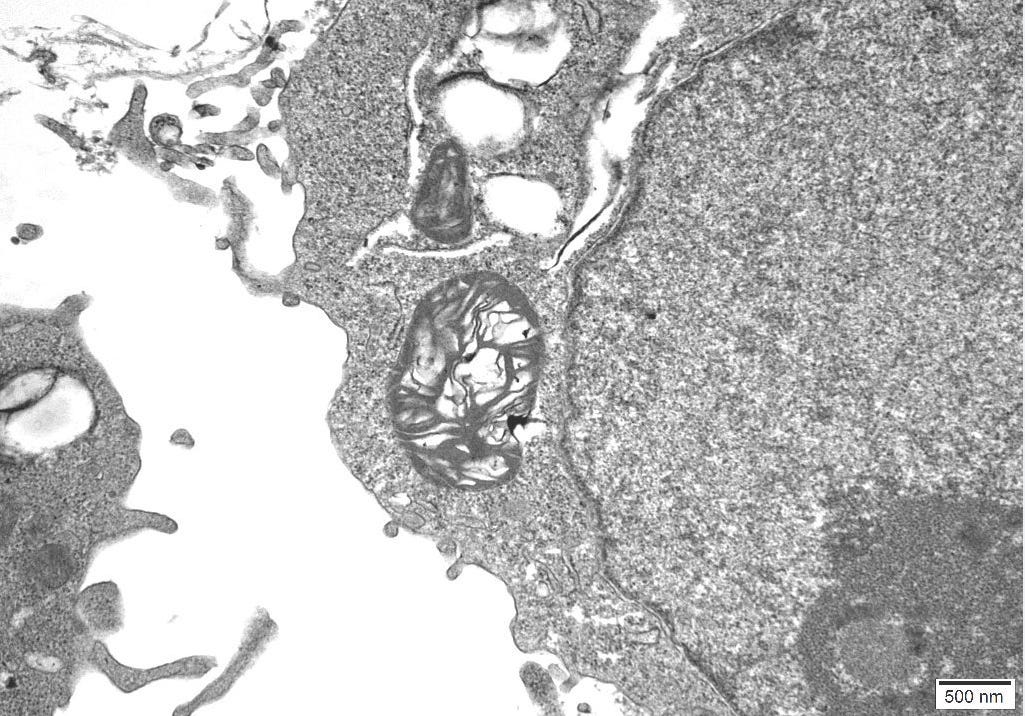
Image 5
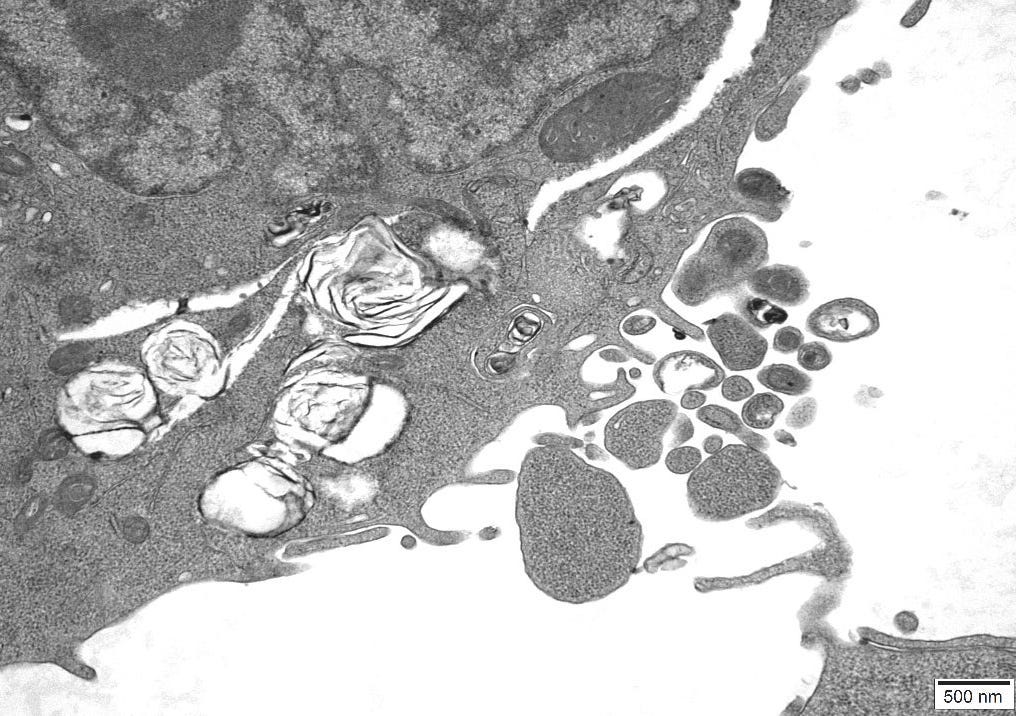
Image 6
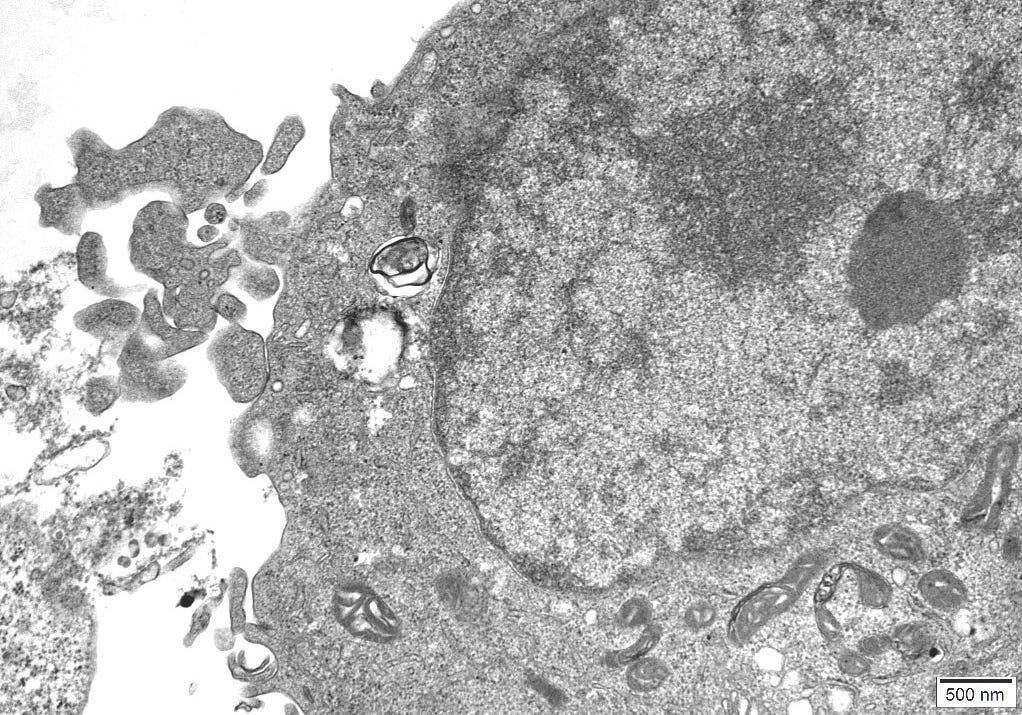
Image 7
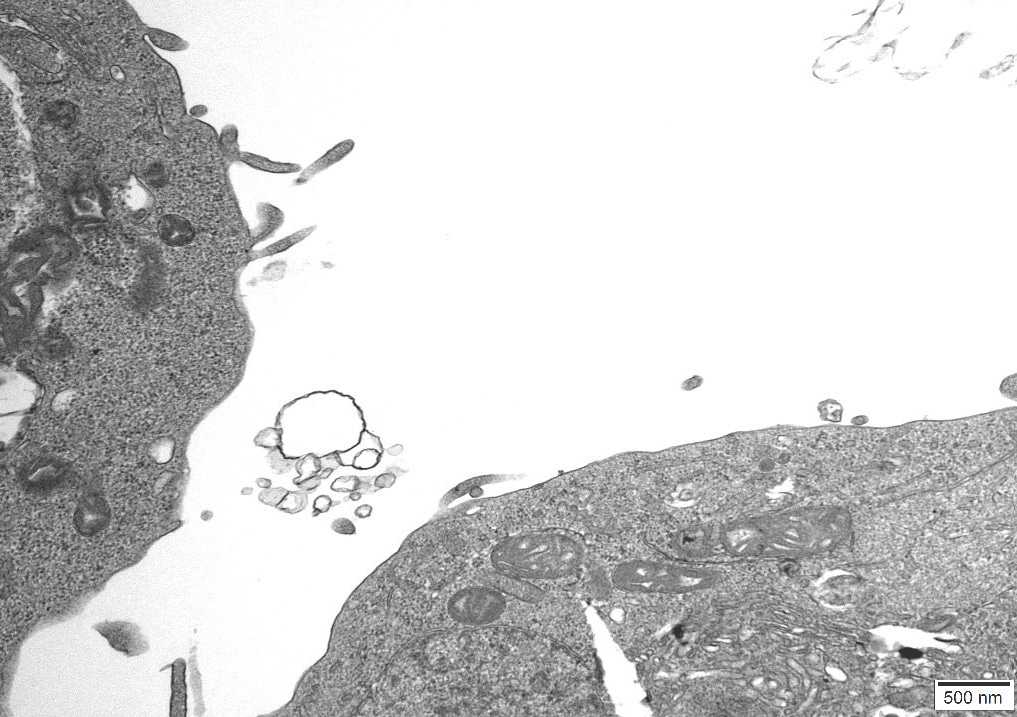
Image 8

Image 9
Good work!
One would also have to take into account that "patient samples" were exposed to unknown preconditions. These could be Treatment with antiviral drugs and/or antibiotics due to "illness" even before the smear was taken (by a doctor), traces of unknown substances in body fluid that have already influenced the smear before and changed it in favour of the "CPE", changed and fluctuating conditions during storage and transport of the smear compared to the industrially produced cell culture, which was stored under constant, non-fluctuating, artificial conditions. In my opinion, even the age of the smear and the "incubation period" in the patient should be taken into account.
To my knowledge, the history of the patient's swab is not mentioned in any study on the "detection of viral particles" and could influence the result in favour of the virologists' expectations. Despite this "competitive advantage" in the evidence of alleged viral presence, the result with the patient sample cannot be distinguished from the result in the control experiment, except for the slightly different speed of decay, which can be explained by the arguments mentioned above.
And this brings virology back to the coin toss.
Great writeup Matthew!